Understanding the COVID numbers
Published 12:05 am Saturday, April 4, 2020

|
Getting your Trinity Audio player ready...
|
LAPLACE – People are being bombarded with numbers and statistics during these times of daily COVID-19 updates. Some people may completely understand all the information, but for many who have been out of school quite for some time, an explanation of some of the terms being thrown around might be in order.
Some of the numbers are straightforward enough. However, one needs to be sure what the number represents. Statistics are being given on the number of tests being administered, the number of positive coronavirus infections, the number of people who are in infected and in hospitals, the number who are infected in hospitals and on ventilators and, thankfully, even the number of people who recovered from a coronavirus infection. They are also being given with respect to location, typically either by parish or the state level.
One of the regular numbers that is not so straightforward is the number of COVID-19 related deaths in the last 24 hours. Of course, that number does include the coronavirus deaths that happened over the last day. However, it also includes deaths that were previously not reported or deaths that were reported and COVID-19 has only recently been confirmed as the cause of death.
The statistical term per capita is from the Latin and literally means “by the head and is usually expressed as a percentage. When a per capita number is given, it represents a targeted number of items divided by the total possible number of items.
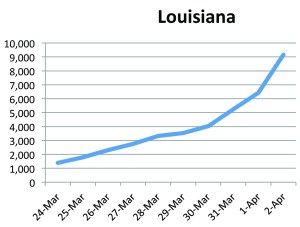
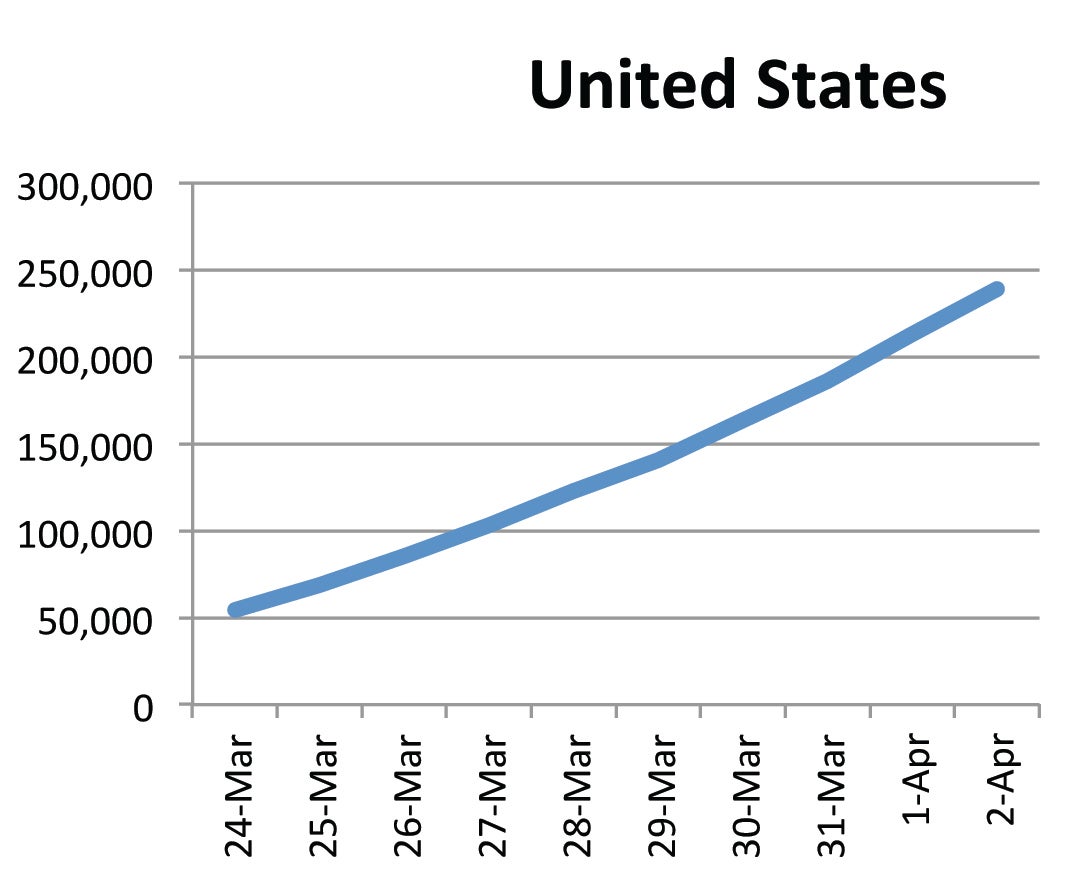
These two graphs both show upward trends in increasing COVID-19 cases. However, the Louisiana graph shows infections growing at a faster rate than the United States as a whole (Graphic by Gary Wayne Dupré).
 Suppose two neighboring houses, one red and one blue, each had one Nobel Prize winner living there. A family of six lives in the blue house. So the per capita rate of Nobel Prize winners in the blue house is one winner for six people – one divided by six (16.7 percent). The red house next door houses a family of five. So, the per capita rate of Nobel Prize winners in the red house is one winner per five people – one divided by five (20 percent). Although the red house does not have more Nobel Prize winners, it does have a higher per capita rate of Nobel Prize winners.
The statement made earlier this week that St. John the Baptist Parish has the highest per capita number of COVID-19 deaths does not mean that it has the largest number of deaths for any county in the nation. It means that when the number of COVID-19 deaths in St. John Parish is divided by the total population of St. John, it produces in the largest number.
When Dr. Alex Billioux of Louisiana’s Office of Public Health said the state’s COVID-related rates are now more closely trending with national rates, it was not necessary for the public to know the exact numbers used to determine a trend. Some people use the word trajectory instead of trend. Before someone can determine that a trend is showing on a graph, there needs to be a significant amount of data showing either a growth or a decline in the numbers. Shown on a graph, the trend line rises or falls from its origin point. Dr. Billioux’s statement is saying not that Louisiana’s data is identical to the country as a whole, but that Louisiana’s data is moving in the same direction as the country on a graph. If the country’s numbers are improving, then so is Louisiana’s. If the country’s numbers are declining but only slightly, then Louisiana’s numbers would also be slightly declining.
When people speak of flattening a statistical curve, this means a graph that was trending upwards stops going up and no longer increases in value. The best example of this is given by looking at a graph of South Korea’s COVID-19 numbers which are no longer increasing. This shows as horizontal motion on a graph, neither increasing nor decreasing.
If you have any questions of concerns about the coronavirus, please call 211 for assistance.